

SEO reporting is the process of turning search and website performance data into a clear account of what changed, what may explain the change, what work was completed, and what should happen next. For beginners, the difficult part is rarely finding more metrics. It is choosing the right metrics, keeping different data sources distinct, and explaining the evidence without claiming more certainty than the data supports.
- A useful SEO report helps a stakeholder make a decision. It should explain what changed, why the change matters, what was done, and what should be reviewed next.
- Google Search Console and Google Analytics should be labelled separately because they measure different parts of the journey and their totals are not expected to match exactly.
- Report only the metrics that support the site’s actual goals, then use a consistent comparison period so movement can be interpreted in context.
- Do not jump from correlation to causation. Check affected queries, pages, devices, countries, releases, campaigns, and seasonal demand before explaining a change.
- Close with specific next actions that identify the affected page or query group, the reason for the action, and the evidence that will be reviewed afterwards.

What SEO Reporting Is and Why It Matters for Stakeholders
SEO reporting is more than exporting a dashboard. A report organises evidence so a client, manager, editor, or business owner can understand performance and decide what deserves attention next. That usually means answering four questions: What changed? What may explain it? What work was completed? What happens next?
The word may matters. Search performance can move because of several factors at once, including demand, seasonality, competitors, site changes, search-result presentation, tracking changes, or work carried out by the SEO team. A report should connect relevant evidence without presenting a simple before-and-after relationship as proof of cause.
Start by agreeing what the report is meant to support. A lead-generation site may care about qualified enquiries, while an ecommerce site may focus on revenue or purchases and a publisher may care more about search visibility, engaged readership, subscriptions, or returning users. The metric set should follow that objective rather than a generic SEO template.
It also helps to separate search performance from on-site behaviour. Google Search Console can show how a property performs in Google Search, while website analytics help explain what measured visitors do after arrival. Keeping those layers distinct makes later diagnosis easier.
A beginner report therefore does not need dozens of charts. It needs a small number of well-labelled measures, a suitable comparison period, concise commentary, and a clear record of the decisions the data supports.
Separate Google Search Console and GA4 Data Before You Interpret It
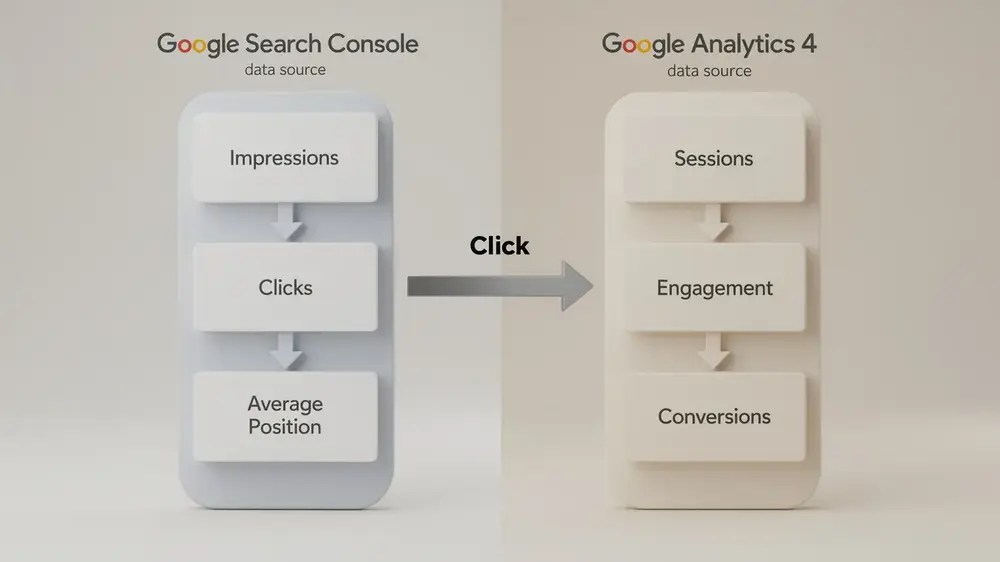
Google Search Console and Google Analytics can be used together, but they should not be treated as two versions of the same dataset. Google’s own guidance describes Search Console as the source of truth for performance in Google Search and Google Analytics as the source of truth for behaviour on the site. It also notes that even comparable measures such as Search Console clicks and Analytics sessions are calculated differently, so their totals will not match exactly. See Google’s guide to using Search Console and Google Analytics data together.
For the Search Console section, common Performance report metrics include clicks, impressions, click-through rate (CTR), and average position. These describe search visibility and interaction before a visitor reaches the site. Query, page, country, device, and search-appearance breakdowns can help explain where a change is concentrated rather than leaving the report at property-level averages.
For the GA4 section, focus on measures that describe the visit and the business outcome. Depending on the site’s setup, this can include organic sessions, engagement rate, landing-page performance, key events, and revenue or other configured outcomes. If you need more background on this layer, MOCOBIN’s guide to using Google Analytics for SEO explains how GA4 fits into organic search analysis.
The practical sequence is simple:
- Search Console: Did Google Search visibility or search clicks change, and which queries or pages account for that movement?
- GA4: What happened during measured visits from organic search, and did those visits support the site’s intended outcomes?
- Interpretation: Do the two sources show a consistent pattern, or is there a discrepancy that needs to be investigated before a conclusion is written?
This prevents a common reporting error. A rise in Search Console clicks does not have to equal the same rise in GA4 sessions, and a conversion decline does not automatically prove an SEO visibility problem. Tracking implementation, consent choices, attribution, canonical URLs, time zones, and other measurement differences can affect the comparison.
Build a Report Structure Stakeholders Can Compare Over Time
A stable structure reduces the effort needed to read each new report and makes period-to-period changes easier to compare. The reporting cadence should match how the organisation makes decisions. Monthly reporting is a practical default for many ongoing SEO programmes, but a launch, migration, incident, or fast-moving campaign may need a shorter review cycle.
A Beginner-Friendly Section Order
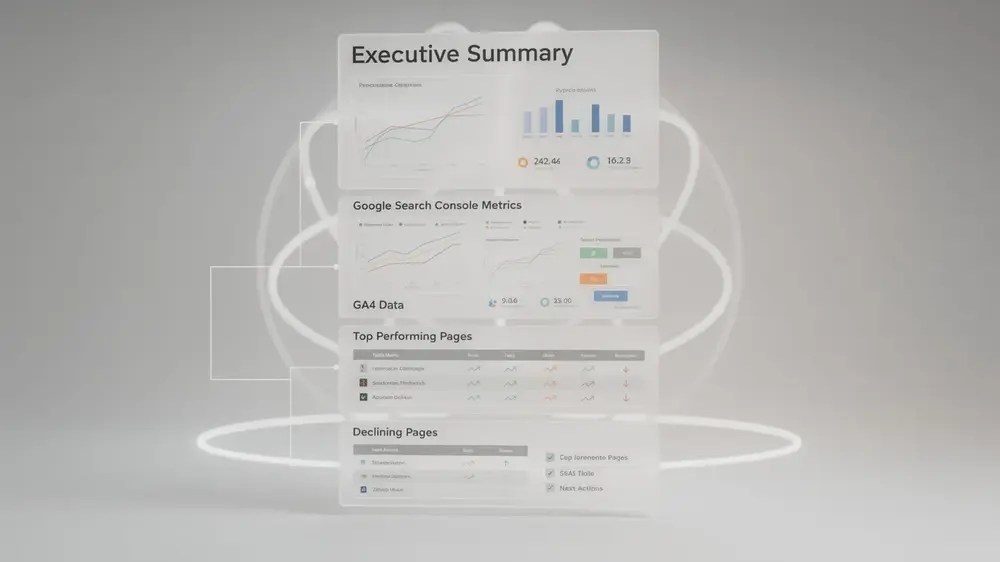
A simple report can follow this sequence:
- Executive summary: State the most important changes, risks, and decisions in plain language.
- Search Console performance: Show the relevant clicks, impressions, CTR, average position, and the pages or query groups behind significant movement.
- GA4 outcomes: Report the organic sessions, engagement, key events, revenue, or other outcomes that match the site’s goals.
- Pages requiring attention: Separate strong performers from pages or query groups that declined, changed unexpectedly, or need investigation.
- Completed work: Record what was implemented during the period and when.
- Next actions: Prioritise the specific work that follows from the evidence.
The sequence moves from the decision-level summary to supporting evidence, then back to action. That is usually more useful than presenting every available chart in tool order.
Choose Comparisons That Answer a Real Question
Use the same comparison logic from one report to the next where possible. Month-over-month can help with recent operational movement, while year-over-year may be more informative for seasonal businesses. In some cases, both are useful. The important point is to state the dates and avoid treating a short-term fluctuation as a trend before enough comparable data exists.
The same discipline applies to business value. If the report is expected to support investment decisions, connect activity to the outcomes the organisation can measure rather than relying only on rankings or traffic. MOCOBIN’s guide to SEO ROI provides wider context for connecting organic search activity with costs and business results.

Present Metrics With Context, Not a Ready-Made Explanation
Commentary is useful when it explains the evidence behind a change. It becomes risky when it turns one movement into a confident diagnosis without checking the underlying dimensions.
Suppose clicks increased by 15% while CTR decreased. That combination is not automatically positive or negative. One possible explanation is that the site earned many more impressions from queries or pages with lower CTR, which increased total clicks while reducing the aggregate rate. Before writing that explanation, check query, page, device, country, and search-appearance data to see whether the pattern is actually present.
The same rule applies when performance falls. If Search Console clicks decline, first identify whether the change is site-wide or concentrated in particular pages, queries, devices, countries, or search types. If GA4 organic sessions or key events move differently, check measurement and attribution conditions before assuming that users behaved differently.
Average position also needs care. It is an aggregate Search Console metric, not a fixed rank for every searcher or every query. It can help identify a persistent change, but it should be read alongside impressions, clicks, CTR, and the specific queries and pages affected rather than used as the sole performance verdict.
For a broader diagnostic process, MOCOBIN’s SEO audit guide can help connect reporting anomalies with technical, content, and site-level checks.
A useful commentary note normally contains three parts:
- Observation: What changed, by how much, and during which dates?
- Evidence: Which pages, queries, segments, releases, or external conditions support the explanation?
- Confidence: Is the cause confirmed, strongly indicated, or still uncertain?
A report becomes more trustworthy when it is willing to say that the cause is not yet clear. Good reporting narrows the explanation with evidence instead of turning every correlation into a success story or a failure story.
Record Completed Work Without Overclaiming Its Effect
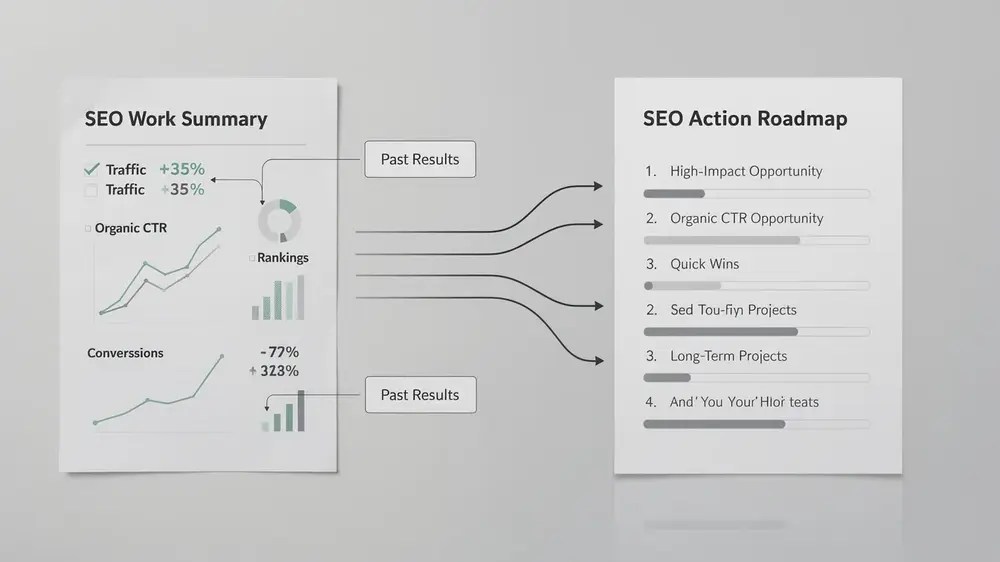
The final part of the report should connect completed work with the next decision. Start by listing material actions that actually went live during the period, such as content updates, technical fixes, internal-link changes, template releases, or indexation work. Include the affected page or area and the implementation date where that detail helps later review.
Separate Implementation From Performance Impact
Do not assume that a metric change proves the preceding SEO task caused it. If crawl or indexation issues were fixed and impressions later increased, record both facts, but distinguish technical validation from performance interpretation. Other releases, demand changes, competitor activity, or search changes may have occurred in the same window.
A stronger reporting note might say that the technical fix was validated, impressions increased during the following comparison period, and the relationship will continue to be monitored. That wording preserves the useful sequence without claiming causation that has not been demonstrated.
Turn the Evidence Into Specific Next Actions
Next actions should identify what needs to be reviewed or changed and why. “Improve content quality” is too broad to manage. “Review the five landing pages that lost the most non-branded clicks and compare their affected queries, intent match, content changes, and indexation status” gives the team a defined task and a reason for doing it.
Likewise, “optimise meta descriptions for the top 10 high-impression, low-CTR queries” should not be automatic. First check average position, query intent, the current title and snippet, device mix, and whether Google is showing the submitted description. The action should follow the diagnosis, not replace it.
Tools can make that review faster, but they do not decide what matters on their own. MOCOBIN’s guide to SEO tools provides a wider view of where Search Console, analytics platforms, crawlers, and third-party SEO software fit into the workflow.
A beginner report is complete when the reader can see the important movement, understand the limits of the explanation, and know which evidence or action comes next. That is a better standard than filling every available dashboard space.


