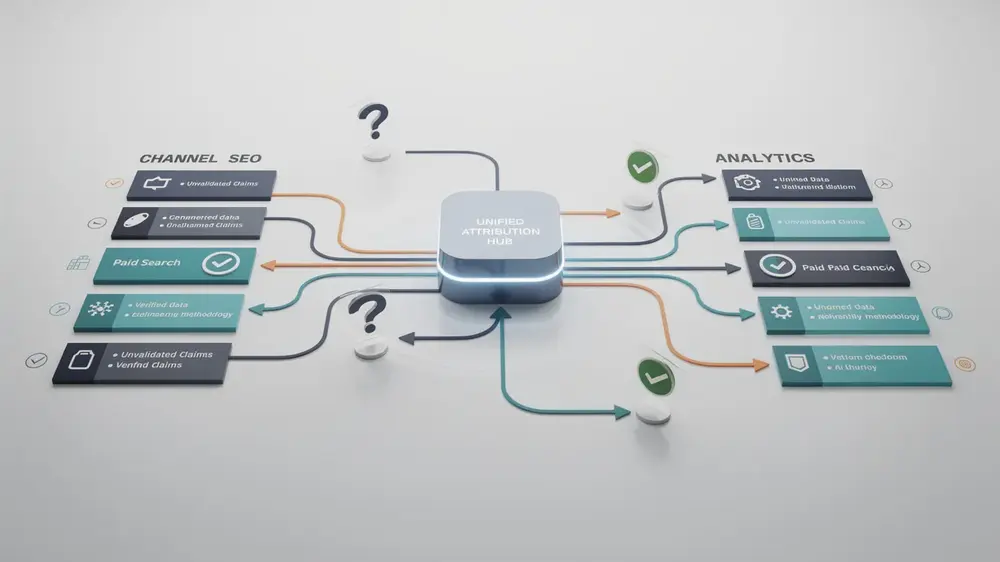
A new industry report, based on $6.7 million in tracked ad spend across nine marketing channels, suggests that kitchen and bath remodeling contractors may need to judge lead generation by cost per acquired project rather than cost per lead alone. In the cited dataset, Google Local Services Ads appeared more cost-efficient than shared-lead platforms, while organic search, Google Business Profile visibility and AI-driven search exposure showed different strengths depending on how leads were attributed and followed through to booked estimates. Because several figures depend on one reporting framework, the data should be read as a useful planning reference, not as a fixed benchmark for every market.
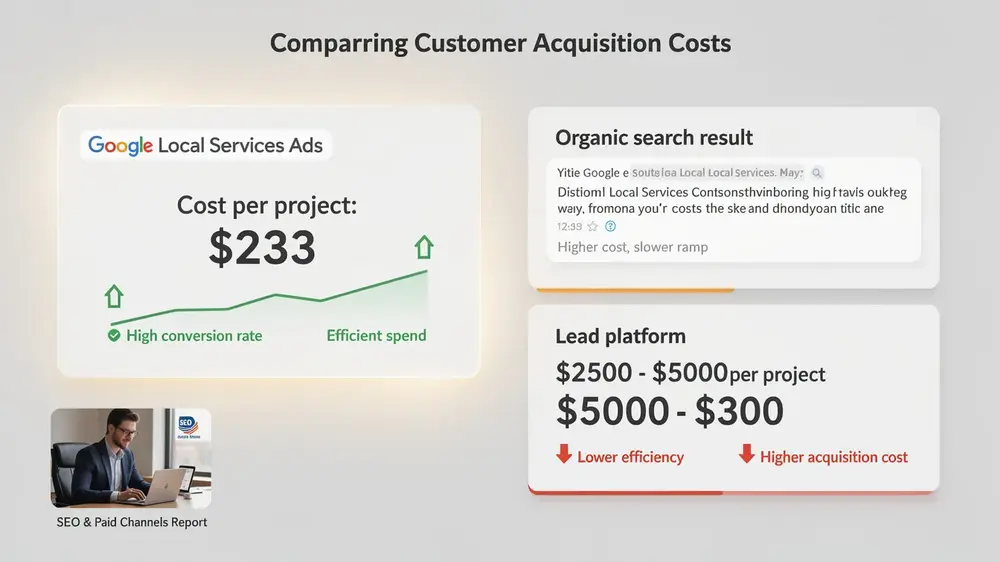
- Third-party lead platforms such as Angi and HomeAdvisor are reported to produce an estimated cost per acquired project of $2,500 to $5,000 once close rates of 5% to 12% are factored in, compared with roughly $233 for Google Local Services Ads in the cited benchmark.
- A February 2026 benchmark from SearchLight Digital, tracking $6.72 million in Local Services Ads spend across 888 contractors, reported a 43.9% booking rate, which gives the LSA comparison stronger supporting context.
- The report claims that AI Overviews appeared in 48% of searches as of April 2026, up from 31% a year earlier, with traffic attributed to those results converting at 14.2% versus 2.8% for standard organic listings. These figures should be treated as dataset-specific until broader validation is available.
- Cost per lead is too limited as a standalone metric for high-ticket remodeling services. Cost per booked estimate, cost per acquired project and closed revenue by channel give a more practical view of performance.
- Several important figures, including the AI Overview conversion rate and the Massachusetts SEO case study results, still need clearer methodology and independent replication before they can be used as general industry standards.
What Changed and Why It Matters
A report released on 09/06/2026 draws on first-party data from 15 U.S. markets and $6.7 million in tracked ad spend across nine marketing channels, including organic search, Google Business Profile, Google Local Services Ads and third-party lead platforms. The findings focus on the kitchen and bath remodeling industry, where the National Kitchen & Bath Association has projected a $228 billion market in 2026 and 4.4% year-over-year growth in professional remodeling spend.
The main issue is not simply which channel produces the cheapest lead. In my experience reviewing service business websites and campaign structures across different markets, the more important question is what happens after the lead enters the pipeline. A low headline CPL can still become expensive if the lead is shared, poorly qualified, difficult to contact or never converted into a booked estimate.
The report argues that third-party platforms such as Angi and HomeAdvisor charge $150 to $600 or more per lead, while those leads close at only 5% to 12%. Under that calculation, the cost per acquired project rises to $2,500 to $5,000. Google Local Services Ads, by contrast, are reported to deliver call leads at $49 to $112 with a 43.9% booking rate, bringing the cost per paying customer down to roughly $233 in the cited benchmark. The gap is large enough to affect how remodeling contractors and local SEO agencies should review their budget allocation, but it should still be checked against each company’s own CRM data before decisions are made.
The search landscape is also changing. AI Overviews are now part of how many users compare services, estimate costs and shortlist local providers. This makes AI Overviews and publisher traffic measurement relevant not only for media websites, but also for local service businesses that depend on search visibility before a user is ready to call. In the report’s dataset, traffic attributed to AI Overview-related visibility converted at 14.2%, compared with 2.8% for standard organic listings. Since attribution methods and conversion definitions are not fully disclosed, I would treat this as a directional signal rather than a universal conversion benchmark.
Key Confirmed Details: Cost and Conversion Benchmarks Across Channels
The report combines first-party campaign data with selected third-party references to compare paid, organic and AI-influenced lead channels for remodeling contractors. The most useful part of the report is not the individual CPL figure, but the attempt to connect lead source, lead quality, booking rate and customer acquisition cost.
Third-party lead platforms carry the highest reported per-lead cost, ranging from $150 to $600 or more. These leads are often shared among three to five competing contractors, which changes the economics of the channel. A contractor may pay for the inquiry, but still compete immediately on speed, price, location, reputation and availability. For a high-ticket service such as kitchen remodeling, this makes the close rate more important than the initial lead price.
Google Local Services Ads performed more efficiently across the client base cited by Kitchen Remodeling SEO, with call leads priced at $49 to $112 and message leads at $25 to $67. A February 2026 SearchLight Digital benchmark, tracking $6.72 million in LSA spend across 888 contractors and 126,650 leads, reported a 43.9% booking rate. That supporting benchmark gives the LSA claim more weight, although each contractor should still separate call leads, message leads, booked estimates and closed projects when reviewing performance.
SEO combined with Google Business Profile produced the lowest long-term cost per lead in the cited material. A Massachusetts case study reached an average CPL of $10.41 at campaign maturity and generated more than 60 leads per month from Google Maps and organic search combined. Those results are useful, but they should not be copied as a promise for every market. Local demand, map pack competition, review strength, website structure, service area density and content quality can all change the outcome.
The report also references NKBA guidance placing the target marketing cost ratio at 5% to 10% of revenue for established remodeling firms. This is a practical way to frame the problem. If a company spends beyond that range on shared leads without improving booked estimate quality or close rate, the issue may not be traffic volume. It may be channel mix, sales follow-up, positioning or local trust signals.
Who Is Affected and the Main Implications
Three groups are most affected by this change in performance measurement: kitchen and bath remodeling contractors, local SEO agencies reporting on those campaigns, and home-improvement publishers or lead aggregators whose business models depend on resale traffic and shared leads.
For contractors, the practical implication is a more careful ROI calculation. Cost per lead alone can hide the real acquisition cost when close rates differ widely across channels. A shared lead that looks affordable at the inquiry stage can become expensive after competition, missed calls, poor fit and low close rate are included. A more reliable reporting structure should include cost per booked estimate, cost per acquired project and revenue generated by lead source.
For local SEO agencies, this is also a reporting issue. Agencies that show CPL without connecting it to closed jobs may give clients an incomplete picture, especially in high-ticket industries where one project can change the month’s results. The reporting pipeline should connect ad platforms, Google Business Profile, website forms, call tracking and CRM outcomes. Without that connection, it is difficult to know whether SEO, LSA, paid search or third-party platforms are truly producing profitable work.
There is also a direct implication for teams working on local SEO strategies for service businesses. In local search, visibility is not only about rankings. It depends on how clearly the business communicates service areas, proof of work, customer trust, reviews, project examples, pricing context and next-step intent. This becomes even more important when AI-generated search results summarize information before the user clicks through to a website.
Practical Response and Next Steps
The first practical step is to stop treating raw lead volume as the main success metric. Contractors and agencies should build a simple channel scorecard that tracks lead source, lead type, booked estimate, closed project, revenue and time to close. This does not need to be complicated at the beginning. Even a clean spreadsheet connected to call tracking and CRM notes can reveal whether a low-CPL channel is actually profitable.
Reporting should include every major source, including Angi, HomeAdvisor, Google Local Services Ads, paid search, Google Business Profile, organic landing pages and referral traffic. The important point is consistency. If one channel is judged by lead count and another by closed revenue, the comparison will be misleading.
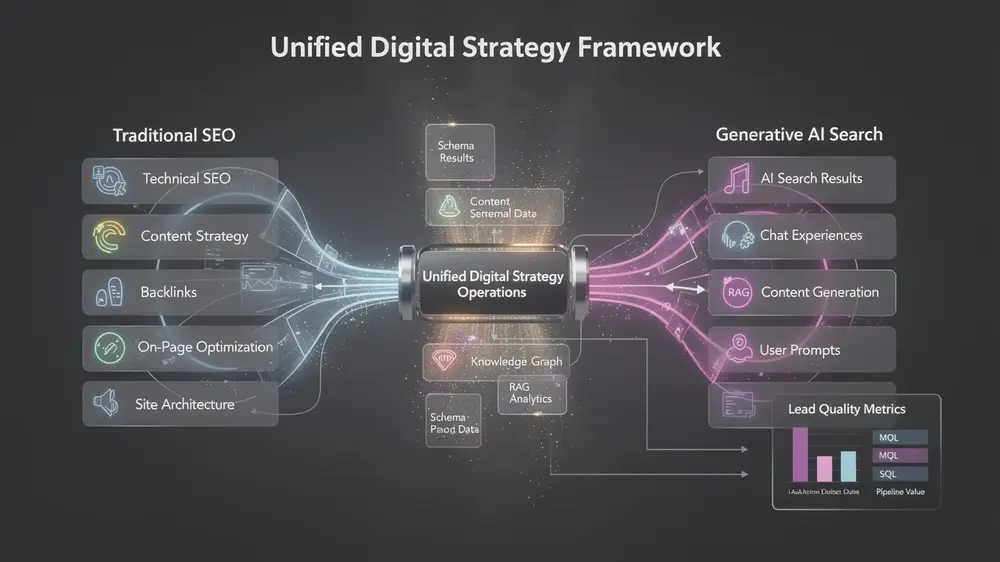
On the organic side, Google Business Profile, local landing pages, service-specific content and structured data remain important because they support both traditional search visibility and AI-assisted discovery. For AI search readiness, the priority is implementing schema markup and structured content in a way that reflects the real page content. Schema should not be treated as a shortcut. It works best when the page itself already answers clear user questions, shows trust signals and connects logically to the business service.
For WordPress-based remodeling websites, the same logic applies at the operational level. Before adding more content, agencies should check whether the site structure supports service pages, location pages, author or reviewer information, internal links, FAQ sections and conversion paths. A technically clean website with weak content will struggle, but strong content placed inside a confusing structure can also underperform.
Third-party lead platforms deserve a separate review. They may still have value in some markets, especially for newer contractors that need short-term lead flow. But they should be measured against true customer acquisition cost, not only inquiry volume. If shared leads are used, contractors should compare their cost per acquired project against LSA, SEO, referrals and repeat customers before scaling spend.
Signals To Watch
Several open questions remain before the conversion claims around AI Overviews and Local Services Ads can be treated as settled benchmarks. The most important is methodology disclosure. The report covers 15 markets, but it does not fully explain how leads were attributed across channels, how AI Overview traffic was identified, how conversion was defined or what attribution window was used. These details matter because a booked estimate, a qualified lead and a closed project are not the same business outcome.
Independent validation is the next signal to watch. The reported gap between a 5% to 12% close rate for shared leads and a 43.9% booking rate for LSA is substantial. That difference may reflect stronger lead intent, cleaner attribution or a different definition of booking. Until more analysts test the same comparison across multiple markets, agencies should use the figure as a planning reference rather than a guaranteed result.
AI Overview measurement also needs caution. Google’s AI results do not appear equally across every query type, industry or search intent. A cost research query, a local “near me” query and a brand comparison query can behave very differently. Teams monitoring AI local search developments should compare impressions, clicks, assisted conversions and lead quality instead of assuming that all AI visibility produces the same business value.
The Massachusetts case study also needs market-level context. Replicating a $10.41 CPL from SEO and Google Business Profile may depend on competitor density, review strength, search demand, website authority, service area structure, project photography and sales follow-up. In my own work across Korean, Japanese and European-facing websites, I have seen the same SEO framework perform differently when language, trust expectations and user behavior change. That is why local SEO benchmarks should be used as a starting point for diagnosis, not as a promise.
The performance gaps reported here are useful, but a single dataset covering 15 markets is not enough to define a permanent industry standard. Before shifting budget, contractors should check how each channel performs inside their own CRM, including booked estimates, close rates and revenue. The better question is not which channel looks cheapest at the lead stage, but which channel produces sustainable projects under the company’s actual market conditions. – Hyogi Park, MOCOBIN
Authoritative Sources