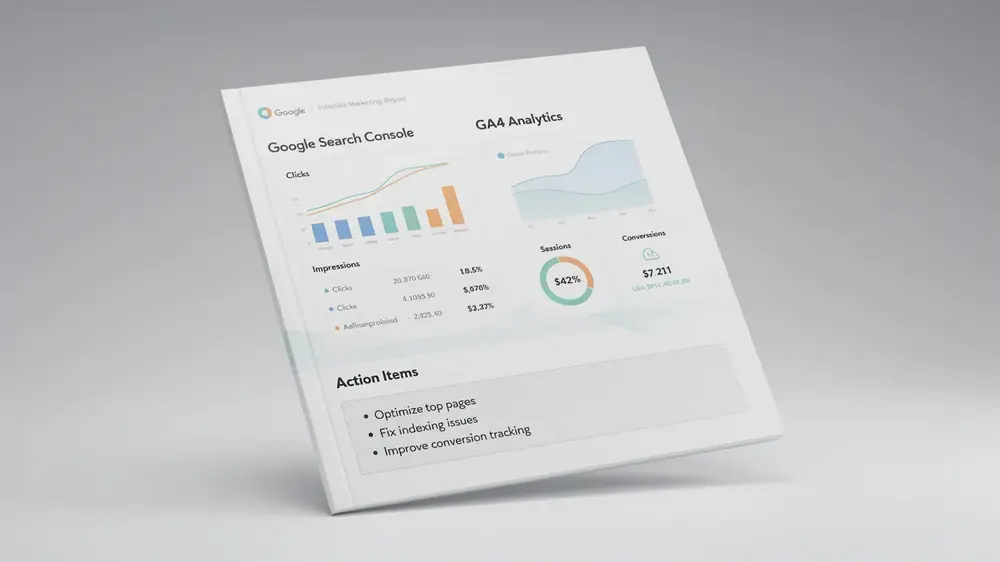
SEO reporting for beginners often stalls at data collection, but the real skill lies in turning search performance figures into structured summaries that stakeholders can read, trust, and act on. A well-built report separates Google Search Console visibility data from GA4 behavioral outcomes, applies consistent formatting across periods, and closes with specific next actions tied directly to what the data shows.
- SEO reporting is distinct from data collection. Its purpose is to connect search activity to business outcomes, not to forward raw numbers from a dashboard.
- Google Search Console and GA4 measure different stages of the user journey and should appear in separate, clearly labeled sections of every report.
- A consistent report structure, repeated monthly, builds stakeholder trust more reliably than a visually polished report delivered on an irregular schedule.
- Every metric should include brief commentary explaining what caused notable movement, since raw figures without context can mislead as easily as they inform.
- Closing each report with three to five specific next actions tied to the data turns the document from a historical record into a working plan.
What SEO Reporting Is and Why It Matters for Stakeholders
SEO reporting is the process of transforming raw search performance data into clear, structured summaries that show stakeholders how SEO activities connect to real business outcomes. It is not simply pulling numbers from a dashboard and forwarding them. The distinction matters because data collection and reporting are two different tasks, and confusing them is one of the most common mistakes beginners make.
Effective reporting focuses on metrics that drive decisions, not metrics that merely look impressive. A high impression count, for example, means little on its own without context about click-through rates, rankings, or goal completions. The goal is to bridge the gap between technical SEO work and the business priorities that leadership actually cares about.
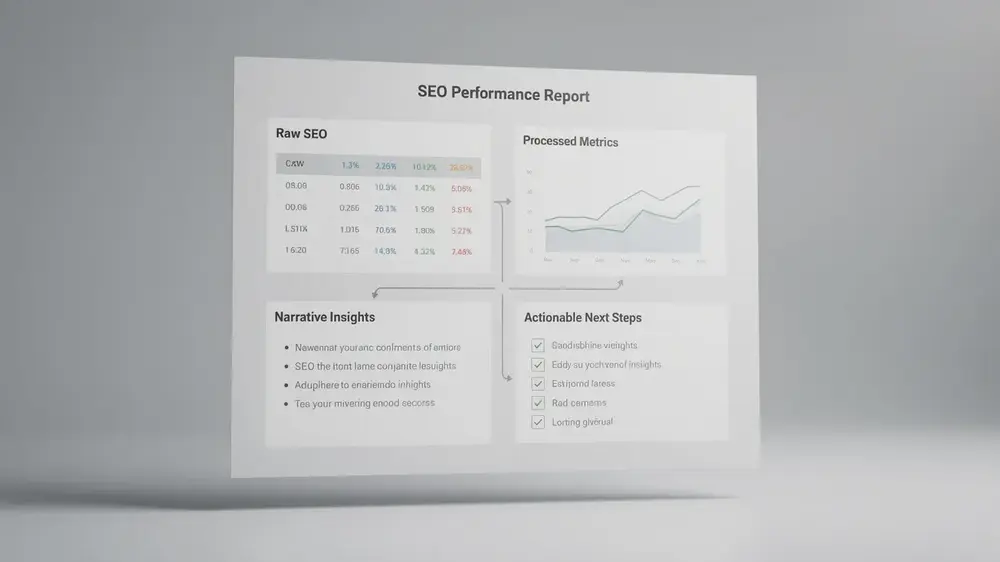
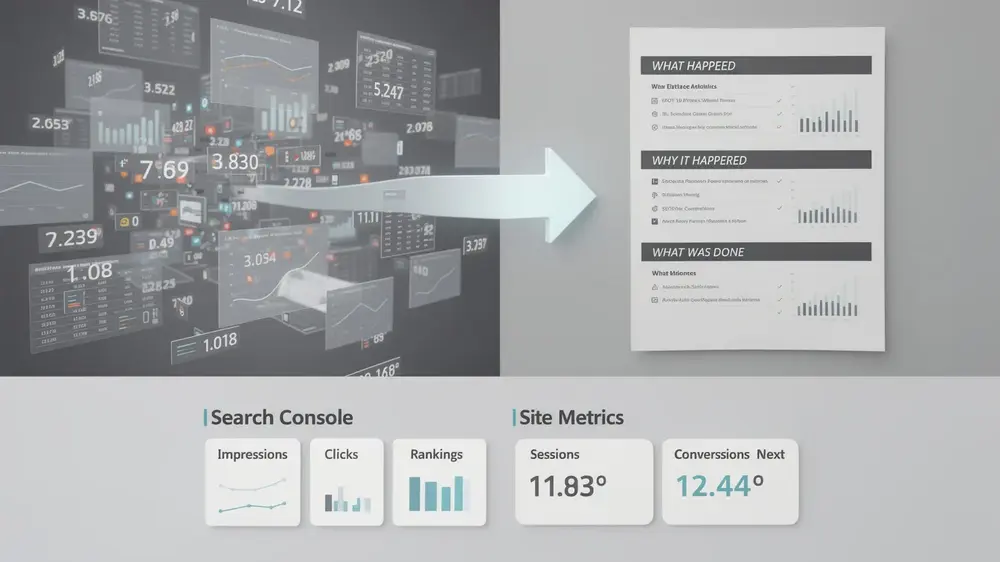
A practical way to structure any SEO report is to answer four questions in sequence: What happened? Why did it happen? What was done? What happens next? This framework keeps the report focused on interpretation and direction rather than raw output. Tools like Google Search Console provide much of the search-side data needed to answer these questions, but the analyst still needs to add context that explains performance shifts over time.
Separating search-side metrics (impressions, clicks, average position) from site-side metrics (sessions, conversions, bounce rate) also helps avoid confusion. When both are mixed without explanation, stakeholders often struggle to understand which signals reflect SEO progress and which reflect broader site or audience behavior. Clear separation creates accountability and keeps SEO efforts aligned with measurable business goals.
Separating Google Search Console and GA4 Data in Your Report
One of the most common mistakes in beginner SEO reporting is treating Google Search Console and Google Analytics 4 as interchangeable. They are not. Each platform measures a distinct stage of the user journey, and mixing their data without clear separation almost always leads to misinterpretation.
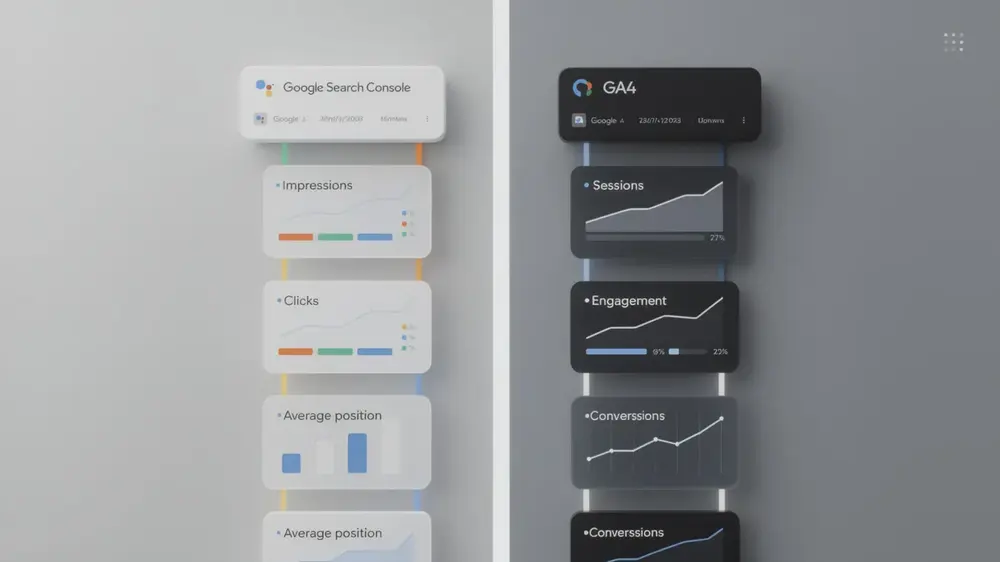
Google Search Console captures search-side metrics: clicks, impressions, click-through rate, and average position. These figures reflect how your site appears in search results and how users interact with those listings before they ever arrive on your site. GA4, by contrast, tracks what happens after the click, covering organic sessions, engagement rate, and conversions. Understanding how Google Analytics connects to SEO performance helps clarify why these two tools answer fundamentally different questions.
The practical workflow is straightforward. Pull your search visibility data from GSC first, then gather behavioral and conversion data from GA4 separately. Present each platform in its own clearly labeled section of your report rather than combining them into a single table or chart.
This separation carries a real strategic benefit. Strong search visibility in GSC does not guarantee strong on-site performance in GA4, and the reverse is equally true. A page can rank well and attract clicks yet still fail to convert, or it can convert efficiently but receive very little search exposure. Keeping the two data sources distinct allows stakeholders to pinpoint whether a problem sits in search visibility or in the on-site experience, which directly informs where resources should go.
Building Your Report Structure: Essential Sections and Consistent Format
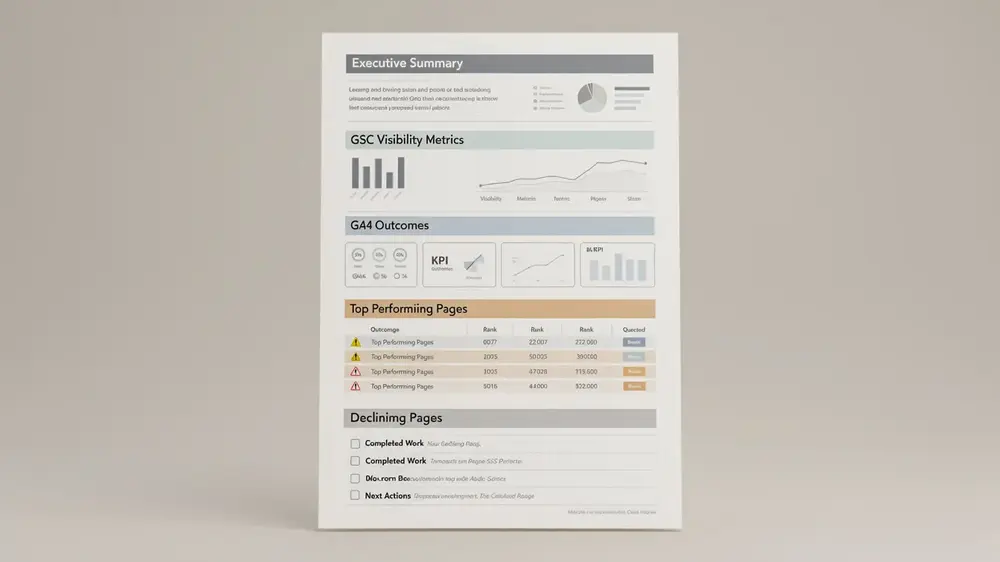
A stable report structure lets stakeholders compare performance across periods without having to relearn the layout each time. That consistency builds trust faster than any visual polish or advanced metric ever will. When starting out, a simple format repeated monthly is far more valuable than a perfect report delivered inconsistently.
A beginner-friendly SEO report should follow this sequence of sections:
- Executive summary: A brief overview of key highlights, risks, and notable changes during the reporting period. This lets stakeholders grasp the overall narrative before reviewing detailed data.
- GSC visibility metrics: Impressions, clicks, average position, and click-through rate pulled from Google Search Console.
- GA4 outcomes: Traffic, engagement, and conversion data tied to business goals.
- Top-performing pages: What is working and why it matters.
- Declining pages or queries: Where visibility or traffic has dropped, with a brief explanation.
- Completed work summary: A record of actions taken during the period.
- Next actions: Clearly defined priorities for the coming period.
Monthly reporting cycles are preferable to daily or weekly ones because short-term data carries too much noise to be actionable. Stick to a limited set of metrics directly tied to business goals, and use consistent time comparisons such as month-over-month or year-over-year. This approach supports clearer measurement of SEO return on investment over time.
Changing the report format between periods forces stakeholders to reorient themselves rather than focus on the data. Inconsistency makes trends harder to spot and erodes confidence in the reporting process itself.
Presenting Key Metrics with Context and Commentary
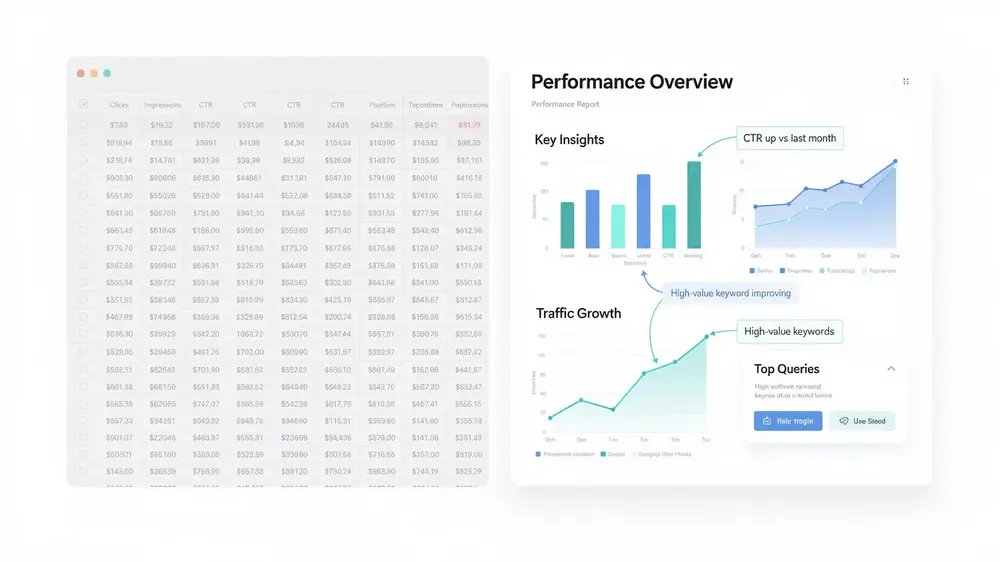
Raw numbers without explanation can mislead stakeholders just as easily as they can inform them. A report that lists clicks, impressions, CTR, and average position without commentary leaves the reader to draw their own conclusions, and those conclusions are often wrong. Context is what separates a data dump from a useful performance report.
For Google Search Console visibility metrics, each figure should come with a brief explanation of what drove any notable change. If clicks rose by 15 percent but CTR fell, that combination can look confusing at first glance. The explanation matters: the site gained impressions in lower-position queries, which signals expanding visibility even though the click-through rate per impression declined. That is a positive development, and stakeholders need to hear that framing clearly.
For GA4 outcomes, focus on organic sessions, engagement rates, and conversions tied to actual business goals rather than surface-level vanity metrics. Every metric should include a comparison to the previous period alongside a short note on what caused significant movement, whether that was a seasonal shift, a completed optimization, or an algorithm update.
Top-performing pages deserve recognition for their contribution to overall traffic and conversions. Declining pages or queries require a different kind of commentary: an honest analysis of why performance dropped and what specific actions will address it. This approach is especially useful when paired with findings from a structured SEO audit process, which can surface the technical or content-level reasons behind performance changes.
Commentary is what transforms a spreadsheet into a story stakeholders can understand and act upon.
A metric without context is just a number waiting to be misread. The real value of SEO reporting is not in the data itself, but in the analyst’s ability to frame what changed, why it changed, and what that means for the business going forward. Stakeholders rarely need more numbers; they need clearer interpretation of the ones already in front of them.
Communicating Completed Work and Defining Next Actions
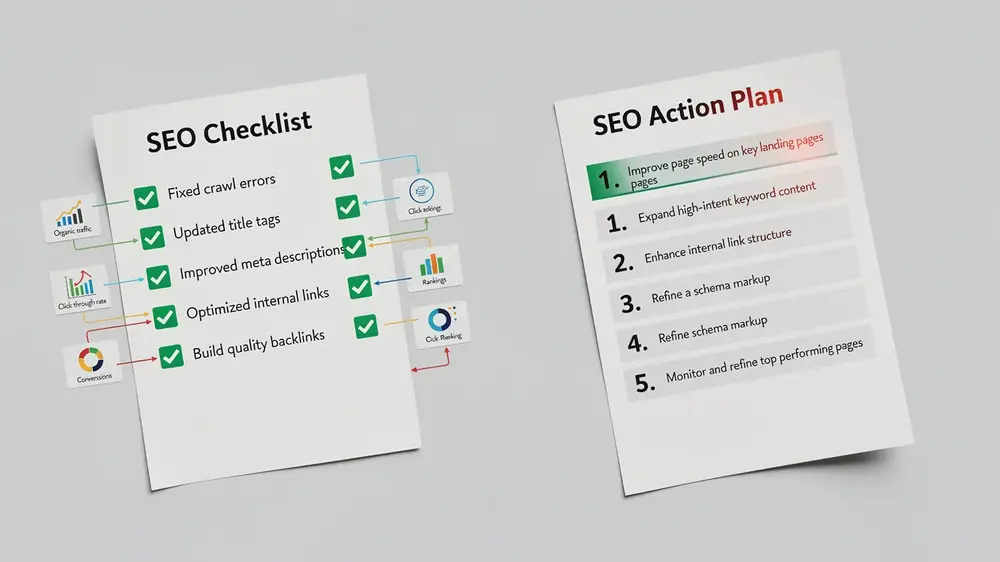
A strong SEO report closes with two clearly separated components: a summary of what was done during the reporting period, and a prioritized list of what comes next. Together, these sections answer the fourth key question of any reporting framework: What happens next? Without them, stakeholders are left interpreting data without context or direction.
The completed work section should be specific. Rather than writing “worked on technical SEO,” describe the actual activities, such as fixing crawl errors, updating title tags across a product category, or building links to a target page. Where possible, connect those actions to the metrics that shifted. If organic traffic to a page increased after a content update, say so directly.
The next actions section is where reporting becomes genuinely useful. Vague statements like “improve content quality” give teams nothing to act on. Specific tasks do. For example, “optimize meta descriptions for the top 10 high-impression, low-CTR queries” tells someone exactly what to do and why it matters based on the data. Similarly, if the analysis reveals that certain pages are ranking but not converting, a logical next step might involve reviewing keyword mapping for those underperforming pages to ensure intent alignment.
Prioritizing next actions by potential impact keeps the report focused. Three to five well-defined tasks are more actionable than a long list of loosely connected ideas. This structure turns the report from a record of past activity into a working plan that moves the project forward.