

Core Web Vitals are three Google-defined metrics for important parts of real-world page experience: loading performance, responsiveness, and visual stability. The current metrics are Largest Contentful Paint (LCP), Interaction to Next Paint (INP), and Cumulative Layout Shift (CLS).
For SEO, the useful distinction is simple. Core Web Vitals tell you how well a page is delivered to users; they do not tell you whether the content is relevant, original, accurate, or the best answer to a query. Google uses Core Web Vitals in its ranking systems, while still emphasising overall page experience and relevance rather than a single performance score.
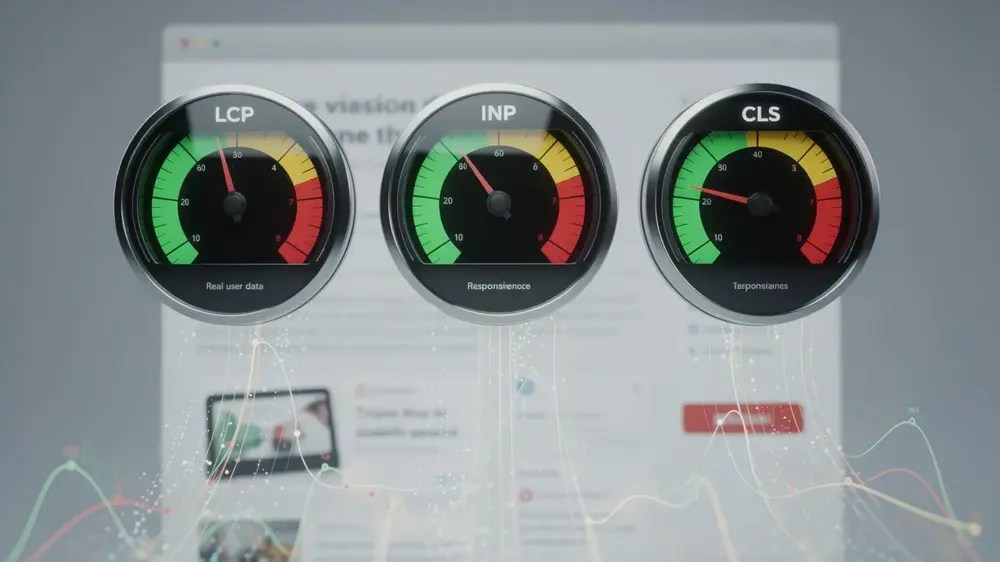
The Three Core Web Vitals and Their Thresholds
Each metric describes a different kind of friction. LCP asks how quickly the main visible content appears. INP asks how quickly the page gives visual feedback after a user interaction. CLS asks whether visible content moves unexpectedly.
| Metric | What it measures | Good | Needs improvement | Poor |
|---|---|---|---|---|
| LCP | Loading performance of the largest image or text block in the viewport | 2.5 seconds or less | Over 2.5 to 4 seconds | Over 4 seconds |
| INP | Overall responsiveness to qualifying user interactions | 200 milliseconds or less | Over 200 to 500 milliseconds | Over 500 milliseconds |
| CLS | Unexpected visual movement of content | 0.1 or less | Over 0.1 to 0.25 | Over 0.25 |
Google recommends assessing the metrics at the 75th percentile, separately for mobile and desktop. In other words, the target is not a pleasing average. The page should provide a good experience for at least 75% of visits represented in the data. Google documents the current thresholds in its Core Web Vitals guidance for Search and on web.dev.
LCP: When the Main Content Becomes Visible
Largest Contentful Paint measures the time from the start of navigation until the largest eligible image or text block in the viewport is rendered. A slow LCP is often associated with a delayed hero image, slow server response, render-blocking CSS, late resource discovery, or main-thread work that prevents the element from being painted.
LCP is not simply an image-size metric. A compressed image can still appear late if the browser discovers it late or if scripts and styles delay rendering. That is why the LCP element and its loading sequence matter more than a generic instruction to ‘make images smaller’.
INP: How Responsive the Page Remains During a Visit
Interaction to Next Paint measures responsiveness across qualifying interactions such as clicks, taps, and keyboard input during the life of a page visit. It is not limited to the first interaction. A page can look fully loaded and still have poor INP when menus, filters, forms, consent tools, or other controls respond slowly.
INP replaced First Input Delay as a Core Web Vital in 2024 because it gives a broader view of interaction responsiveness. In the lab, developers can reproduce slow interactions and use related diagnostics such as long tasks and Total Blocking Time, but the real-user INP value comes from field measurement.
CLS: Whether the Layout Stays Where the User Expects It
Cumulative Layout Shift is a unitless score for unexpected layout movement. Common causes include images without reserved dimensions, ads or embeds that expand after loading, injected banners, and font changes that move surrounding content.
CLS can also occur after the initial page load, which is one reason a quick reload in a lab tool may not reproduce what real visitors experience. The practical question is not merely whether a page looks stable at first paint, but whether it remains stable while people read and interact with it.
How Core Web Vitals Affect SEO
Google states that Core Web Vitals are used by its ranking systems. It also states that there is no single ‘page experience signal’ and that good Core Web Vitals scores do not guarantee top rankings. Search systems still try to show the most relevant content, even when its page experience is not ideal.

This keeps Core Web Vitals in the right place within technical SEO. They are an important quality check, not a substitute for crawlability, indexability, relevance, useful content, or clear site structure. If two pages both satisfy the query well, page experience can contribute to search success, but there is no useful formula that converts an LCP improvement into a ranking gain.
The same caution applies to perfect scores. Google advises site owners not to focus on achieving a perfect score purely for SEO. A technically impressive test result is of limited value if users still struggle with the page, while narrowly missing a threshold does not automatically make a page a poor search result.

Read the Data Before You Decide What to Fix
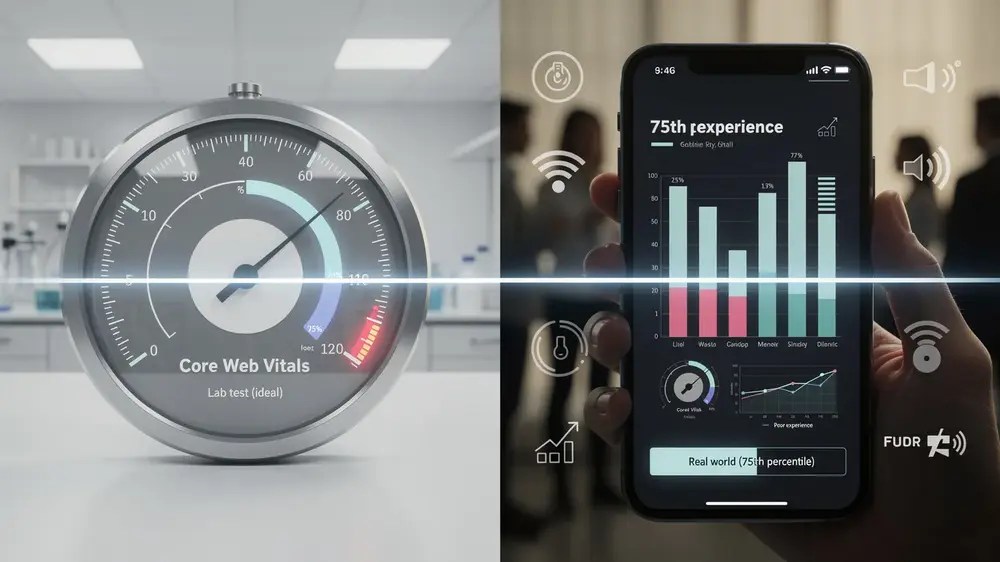
Core Web Vitals are easiest to misuse when field data and lab data are treated as the same thing. They are not.
Field Data Shows What Real Users Experienced
Field data reflects real visits across actual devices, networks, browsers, and usage patterns. Google Search Console’s Core Web Vitals report is based on the Chrome User Experience Report (CrUX). It groups URLs with similar experience patterns and reports separate mobile and desktop views.
The report uses a rolling 28-day view of real-user data. It is also not a complete list of every URL on the site. Search Console only shows groups for which it has enough data, and the group status is determined by the worst-performing available Core Web Vital. A low-traffic page may therefore have no URL-level field data even though the page can still be tested in a lab.
Lab Data Helps Reproduce and Diagnose a Problem
PageSpeed Insights combines CrUX field data, when available, with Lighthouse lab diagnostics. The field section answers, ‘Are real users experiencing a problem?’ The lab section is better suited to, ‘What might be causing it, and can I reproduce it under controlled conditions?’
A green Lighthouse performance score is useful, but it is not a field-data certificate. Lab conditions use a controlled environment, while real users bring a much wider range of devices, connection quality, cached resources, interactions, third-party scripts, and browsing behaviour.
Check Whether the Data Is for the URL or the Origin
PageSpeed Insights can fall back from URL-level CrUX data to origin-level data when the individual page does not have enough samples. That distinction matters. An origin result may describe the wider site rather than the page you are investigating, so confirm which data scope is displayed before changing a template or content asset.
The official Search Console Core Web Vitals report documentation is worth checking when a URL group, status, or data gap seems counter-intuitive.
Diagnose the Weakest Metric, Not the Overall Score
Once field data shows a problem, start with the metric that is failing and the page type that is affected. That sounds obvious, yet it prevents a great deal of unnecessary work.
If LCP Is Poor
Identify the actual LCP element first. If it is an image, check whether the browser can discover it in the initial HTML, whether it has been lazy-loaded, what priority it receives, how long the resource takes to load, and whether CSS or JavaScript delays rendering. Google specifically advises against lazy-loading an LCP image because it adds unnecessary resource-load delay.
If the LCP element is text, the bottleneck may instead involve server response, render-blocking styles, web fonts, client-side rendering, or long main-thread tasks. The metric tells you where the symptom appears; it does not identify one universal fix.
If INP Is Poor
Look for the interactions real users are actually making. Navigation menus, filters, search boxes, forms, accordions, product selectors, consent interfaces, chat widgets, and tracking scripts can all create delays. Heavy JavaScript and long main-thread tasks are common causes, but rendering work can also contribute to interaction latency.
For INP, field context is especially valuable because a default Lighthouse page-load audit cannot reproduce every interaction that occurs during a real visit. Once a slow interaction is identified, reproduce that flow in the lab and inspect input delay, processing time, and presentation delay.
If CLS Is Poor
Check whether space is reserved before images, videos, ads, iframes, and other late-loading elements appear. Width and height attributes, or an equivalent aspect-ratio reservation, allow the browser to allocate space before media loads.
Also look beyond the initial load. Cookie notices, promotional bars, embedded content, lazy-loaded components, and application state changes can move content later in the session. When CrUX shows worse CLS than Lighthouse, post-load layout shifts are one plausible reason to investigate.
A Practical Core Web Vitals Review Order
A useful review does not begin by optimising whichever page is easiest to edit. Start with evidence and work outward:
- Confirm the failing metric and device type. Mobile and desktop can show different results, so do not assume one represents the other.
- Check the data scope. Confirm whether you are looking at a Search Console URL group, URL-level CrUX data, origin-level data, or a Lighthouse lab run.
- Find the affected template or component. A repeated problem across article, category, product, or landing-page groups usually deserves more attention than one isolated URL.
- Reproduce the problem in the right tool. Use lab diagnostics and DevTools after field data has told you what to investigate.
- Verify after the change. Test the page immediately in the lab, then allow enough time for new real-user data to replace older observations in the rolling field-data window.

Core Web Vitals are most useful when they narrow a technical investigation. LCP, INP, and CLS each point to a different type of user friction, and the 75th-percentile thresholds provide a consistent way to judge whether that friction affects a meaningful share of visits. The next step is not to chase a higher score everywhere. It is to identify the affected page group, understand the weakest metric, and fix the underlying cause. If the investigation moves from measurement into implementation, MOCOBIN’s website speed optimisation guide covers the broader performance workflow.
- Google Search Central: Understanding page experience in Google Search results
- Google Search Central: Core Web Vitals
- web.dev: Web Vitals
- web.dev: Optimize Largest Contentful Paint
- web.dev: Optimize Interaction to Next Paint
- web.dev: Optimize Cumulative Layout Shift
- Google Search Console: Core Web Vitals report


