Chrome DevTools is a built-in browser inspection tool that helps SEO practitioners check how a page is rendered after HTML, CSS, and JavaScript have loaded. In technical SEO work, this matters because the raw source code, the rendered DOM, and the version search engines eventually process may not always match. DevTools should not be treated as a replacement for Google Search Console or URL Inspection, but it is one of the fastest ways to identify rendering, metadata, canonical, and JavaScript-related issues before they become indexing problems.
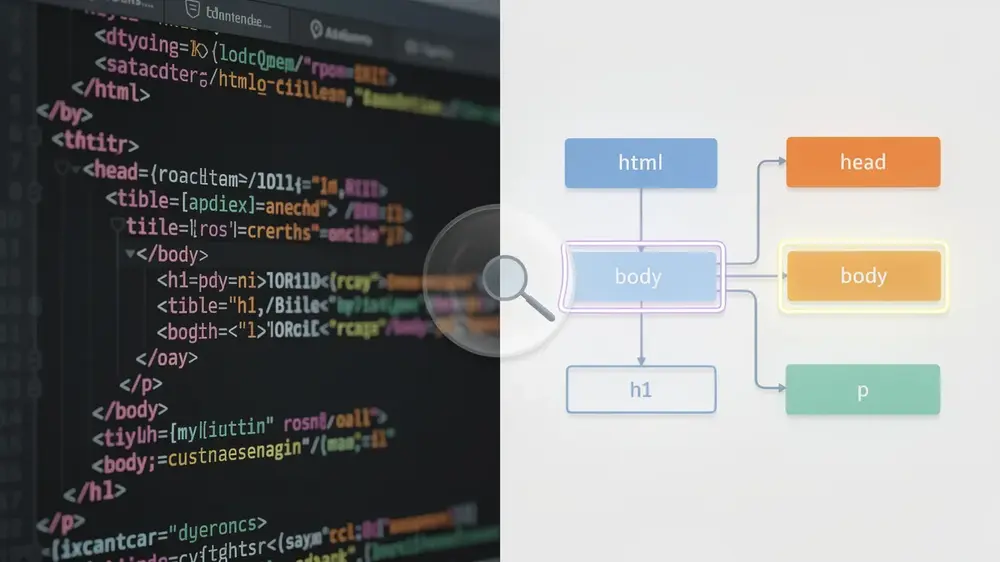
- Rendered DOM is different from raw source: The Elements panel shows how the page looks after the browser has processed scripts, while View Page Source only shows the initial HTML response.
- SEO tags can be checked directly: Title tags, meta descriptions, robots directives, canonical URLs, hreflang annotations, and structured data scripts can be reviewed inside DevTools.
- JavaScript can create visibility gaps: Content may appear on screen but still be delayed, altered, or unavailable in ways that affect crawling and indexing.
- DevTools is an early diagnostic layer: It helps you find page-level issues quickly, but Google-specific confirmation should also use Search Console, URL Inspection, and testing tools.
- Regular checks reduce technical regressions: CMS updates, plugins, page builders, caching systems, and deployments can change live SEO elements without obvious visual signs.
What is Chrome DevTools and Why It Matters for SEO Basics
Chrome DevTools is a native set of web development tools built directly into Google Chrome. It allows users to inspect, debug, and analyse the structure and behaviour of any web page in real time, without installing a separate SEO extension. For SEO teams, content managers, and site operators, its value is practical: it helps confirm what the browser actually renders, not only what a CMS field, plugin setting, or developer note suggests should be present.
This distinction is important in technical SEO fundamentals. A page can look correct in the WordPress editor, appear correct to a visitor, and still contain a technical issue in the rendered HTML. The raw HTML source, rendered DOM (Document Object Model), and the version Google eventually crawls and indexes are connected, but they are not always identical.
In day-to-day SEO work, DevTools is useful because many implementation problems are not visible on the surface. A page may have a duplicated title tag, a noindex directive left from staging, a canonical URL pointing to the wrong version, or important content injected only after JavaScript runs. These issues are easy to miss during a normal content review, especially on websites that use page builders, tag managers, scripts, or aggressive caching.
The primary SEO elements you can verify through DevTools include:
- Title tags and meta descriptions
- Robots meta tags
- Canonical URLs
- Hreflang annotations on multilingual or international websites
- Structured data scripts, including JSON-LD markup
- JavaScript-rendered content that may be missing from the initial HTML source
For beginners, DevTools can feel technical at first. In practice, it becomes easier when treated as a routine verification checkpoint rather than an advanced developer-only tool. The goal is not to debug every line of code. The goal is to confirm whether the SEO-critical parts of a live page are present, readable, and consistent with the page’s intended search purpose.
How Chrome DevTools Impacts Crawling, Indexing, and Search Visibility
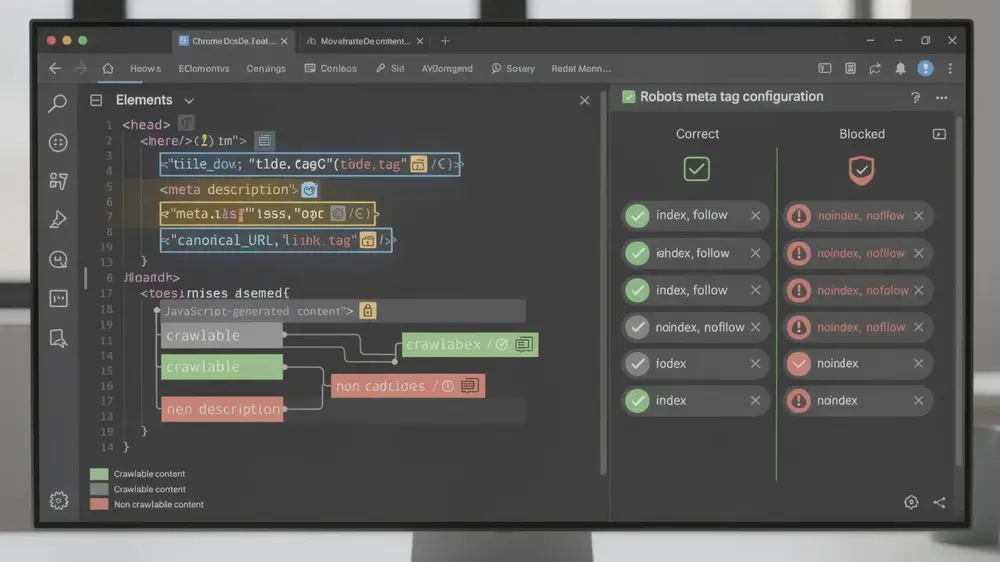
Chrome DevTools gives SEO practitioners a direct way to verify that important page elements are correctly implemented and visible in the rendered page. This is especially useful when reviewing the crawling and indexing process, where blocked resources, noindex directives, canonical conflicts, or JavaScript rendering gaps can change whether a page becomes eligible for search visibility.
One of the most practical uses is identifying indexing blockers. An incorrect robots meta tag configuration can quietly prevent a page from appearing in search results. This often happens after a page has been copied from a template, migrated from a staging environment, or adjusted by a plugin. DevTools helps surface these directives directly in the rendered page, where they are easier to verify than inside a crowded CMS interface.
As more websites rely on client-side rendering, inspecting the rendered DOM becomes more important. JavaScript-generated content may appear visually in a browser but still create SEO risks if it is delayed, blocked, inconsistent, or missing from the HTML that crawlers can process reliably. DevTools helps you compare what appears on screen with what is actually present in the browser’s processed document.
Canonical URL verification is another area where DevTools adds value. Confirming that the correct canonical tag is present, absolute, and pointing to the preferred page version helps search engines consolidate ranking signals more clearly. This is particularly important on websites with URL parameters, category archives, duplicate templates, or international versions.
DevTools does not show the final indexed version of a page. For that, Google Search Console and URL Inspection are still necessary. However, it does help you find the page-level issue early, before moving into broader testing. In a practical workflow, DevTools answers the first question: what does the browser render? Search Console then helps answer the second question: how has Google processed this URL?
How to Use Chrome DevTools to Check Essential SEO Elements
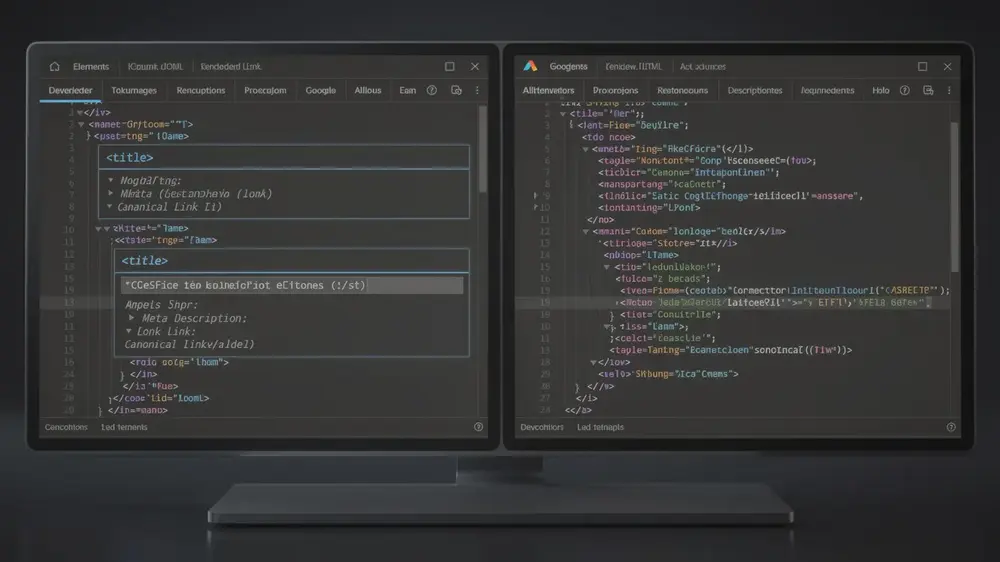
Chrome DevTools gives you access to the rendered state of a page, making it one of the most reliable first steps for checking whether critical SEO tags are present after the browser has finished processing the page. To open it, right-click anywhere on a page and select “Inspect,” or use Ctrl+Shift+I on Windows or Cmd+Option+I on Mac.
Locating Key Tags in the Elements Panel
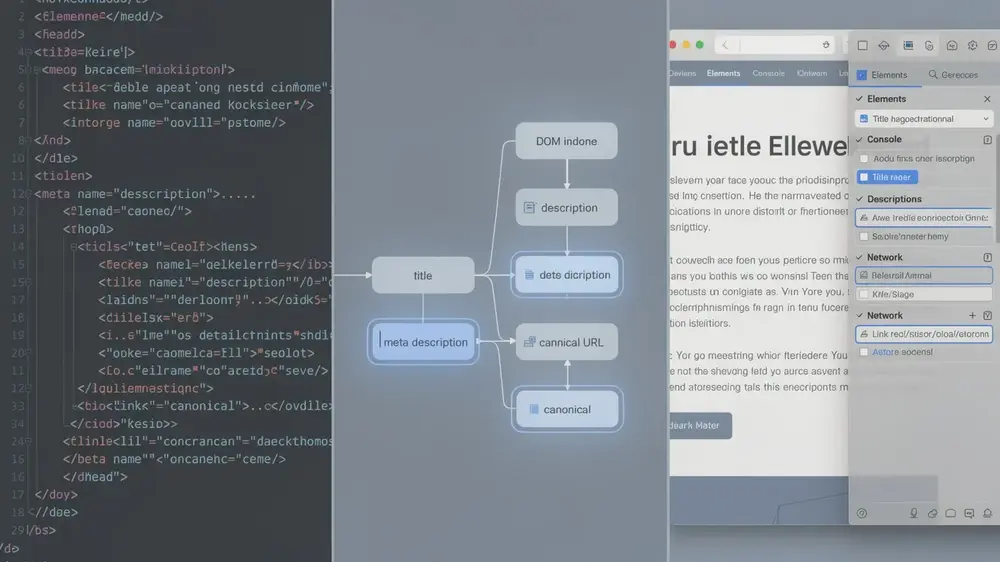
Once DevTools is open, navigate to the Elements panel. This view shows the rendered DOM, meaning it reflects changes JavaScript has made after the initial HTML loaded. Use the search function (Ctrl+F or Cmd+F) to find specific tags quickly. Search for title to check the title tag, meta name=”description” for the meta description, meta name=”robots” for indexing directives, and link rel=”canonical” for canonical URLs. When reviewing canonical tags, confirm that they use absolute URLs with the correct protocol, domain, and preferred page path.
Comparing Rendered DOM Against Raw Source
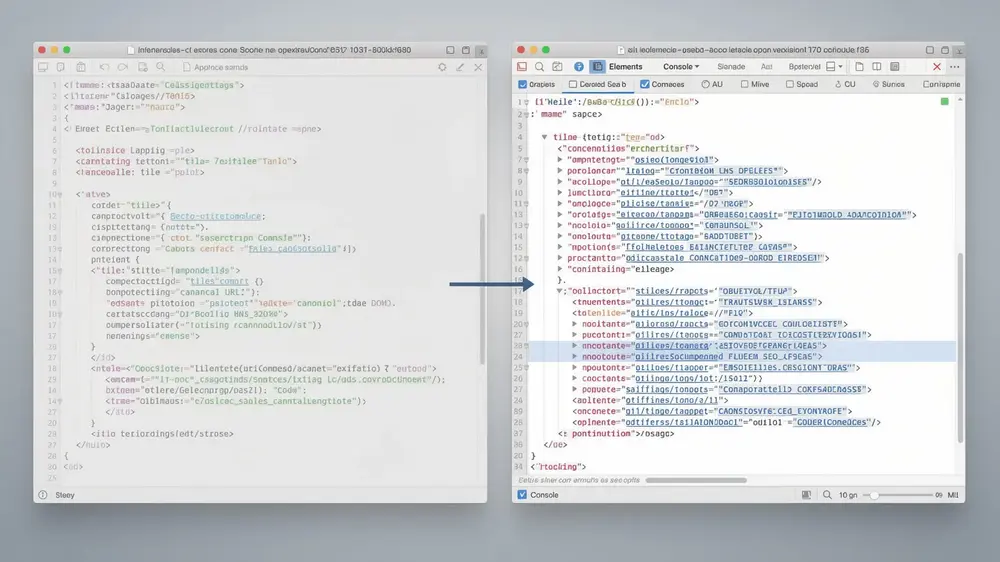
A useful step is comparing the Elements panel output with the raw HTML source, accessible via Ctrl+U or View Page Source. Any differences between the two indicate that JavaScript, a page builder, a plugin, or another layer is modifying SEO-critical elements after the initial HTML loads. This is a common issue worth investigating through JavaScript SEO fundamentals, especially on websites where important content, links, or metadata depend on scripts.
For quick programmatic checks, the Console panel can also retrieve live tag values without manually scanning the DOM. For example, document.title shows the live page title, while document.querySelector(‘meta[name=”robots”]’)?.content can help check whether a robots directive is present. These commands are not a complete SEO audit, but they are useful for confirming what the browser currently sees.
Practical SEO Checks to Run in Chrome DevTools
A simple DevTools SEO review should follow a repeatable order. First, inspect the rendered <head> section and confirm that the title tag, meta description, robots meta tag, canonical tag, hreflang annotations, and structured data scripts are present where expected. Next, compare the Elements panel with View Page Source to identify JavaScript changes. Finally, test whether important body content, internal links, and navigation elements remain visible when JavaScript is disabled.
- Check whether the title and meta description match the intended page topic.
- Confirm that no accidental noindex directive appears on pages intended to rank.
- Verify that the canonical URL is absolute, indexable, and consistent with internal links.
- Review whether structured data scripts appear in the rendered page before running deeper Article schema validation.
- Compare visible content with rendered HTML to detect JavaScript-dependent gaps.
- Use Google Search Console URL Inspection when you need to confirm how Google processed the page.
Critical Mistakes to Avoid When Using Chrome DevTools for SEO Verification
One of the most damaging habits in technical SEO work is treating raw HTML source and the rendered DOM as interchangeable. They are not the same. View Page Source shows only the initial HTML delivered by the server, before JavaScript runs. The Elements panel in DevTools reflects the page after browser processing. Relying on the source view alone can create false confidence about metadata, canonical tags, structured data, and content that may have been added or altered client-side.
Several specific errors appear frequently in practical SEO reviews:
- Assuming metadata is correct based on CMS settings rather than inspecting the rendered page directly. SEO plugin fields are useful, but the live output is what needs to be verified.
- Overlooking JavaScript-driven changes that add, modify, or remove SEO-critical elements after initial page load. These changes may be invisible in the raw source.
- Using relative canonical URLs instead of absolute URLs with full protocol and domain. This can create canonicalisation ambiguity, especially across subdomains, staging environments, and multilingual setups.
- Misreading robots meta directives, particularly failing to catch noindex tags on pages intended to rank. A single incorrect directive can remove a page from search results.
- Checking only desktop rendering while ignoring mobile output. Since mobile-first indexing makes the mobile version central to Google’s understanding of a page, mobile checks should be part of the review process.
- Confusing browser rendering with Google indexing. DevTools shows what the browser renders, but Search Console is still needed to understand Google’s handling of a specific URL.
Pairing DevTools inspections with Google Search Console monitoring gives a more complete picture. DevTools confirms what the browser renders on the live page, while Search Console helps show how Google has crawled, indexed, or reported the URL. The two tools answer different questions, and reliable technical SEO work usually needs both.
Verification tools only protect a site when they are used consistently. A single DevTools check at launch only proves that the page was correct on that day. CMS updates, template edits, caching changes, and script deployments can quietly undo that work. Browser-based inspection is most valuable when it becomes part of a repeatable SEO review routine, not a last-minute troubleshooting step.
Advanced DevTools Techniques and the Evergreen Value of Browser-Based SEO Verification
Chrome DevTools has lasting value in SEO practice because it gives direct, real-time visibility into how a browser processes a page. Search systems, ranking signals, and content formats will continue to evolve, but one operational question remains consistent: what do browsers and crawlers actually receive?
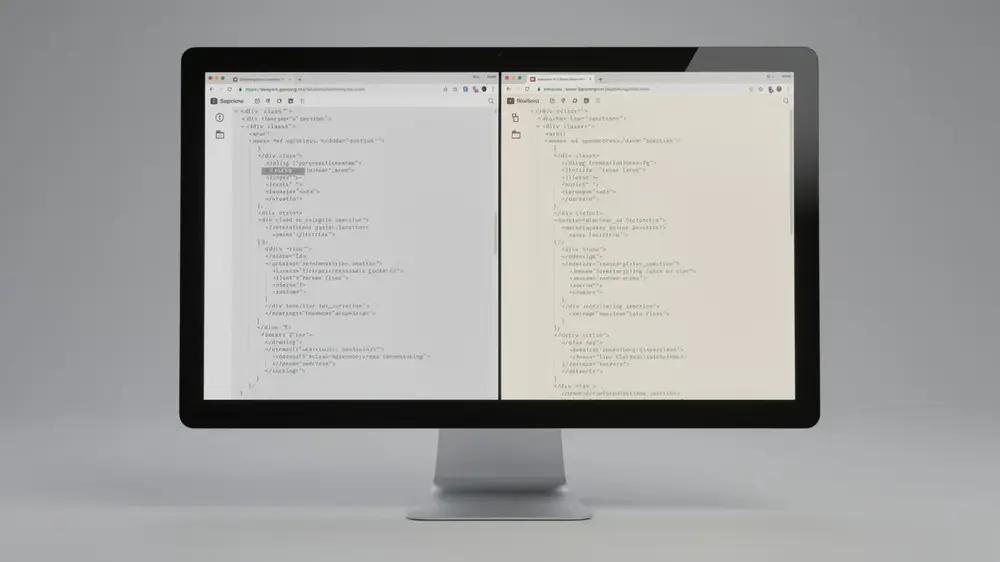
One of the most revealing advanced techniques is testing JavaScript rendering behaviour. By disabling JavaScript in DevTools settings and comparing that stripped-down view against the fully rendered version, you can identify content that may become invisible or incomplete when scripts fail, load slowly, or are blocked. This does not mean every site must work perfectly without JavaScript. It means SEO-critical content, internal links, and metadata should be implemented in a way that search engines can process reliably.
DevTools works best when it is part of a broader workflow. Use it for page-level browser inspection, then compare the findings with a Screaming Frog SEO audit, Search Console data, and dedicated testing tools to build a fuller picture of technical SEO health. Checking canonical tag implementation across rendered pages is a practical example of where this combined approach can catch issues that any single tool might miss.
A Lighthouse SEO audit can also support this workflow, especially when reviewing performance, accessibility, best practices, and basic SEO checks inside a browser-based environment. DevTools, Lighthouse, crawlers, and Search Console should not compete with one another. They are stronger when used together, with each tool answering a different part of the technical SEO question.
Regularity matters. CMS updates, template changes, plugin conflicts, tag manager edits, and code deployments can quietly break SEO implementations that were previously correct. Running DevTools checks only during initial setup is not enough. Building periodic browser-based verification into your audit routine helps catch regressions earlier, before they affect crawling, indexing, or user trust.
In practical technical SEO audits, DevTools is most useful when it is used as an early diagnostic layer rather than the final source of truth. It can reveal what the browser renders, but Google Search Console’s URL Inspection Tool, crawl reports, and structured data testing tools should also be used when you need to confirm how Google crawled, rendered, and interpreted a specific URL.